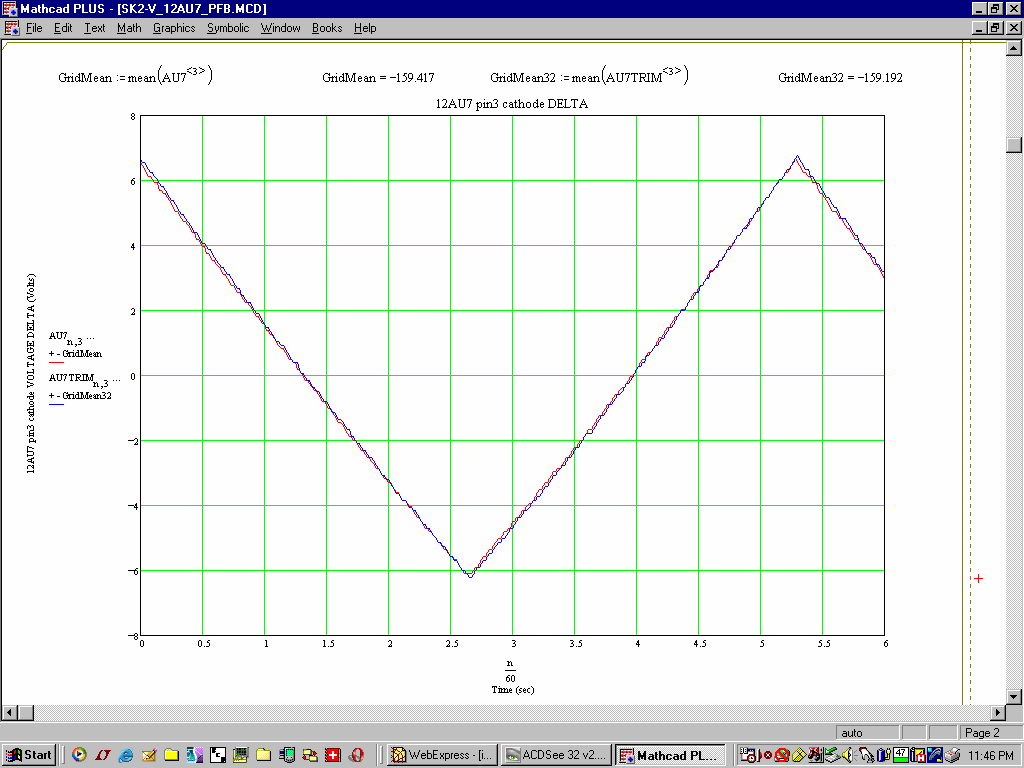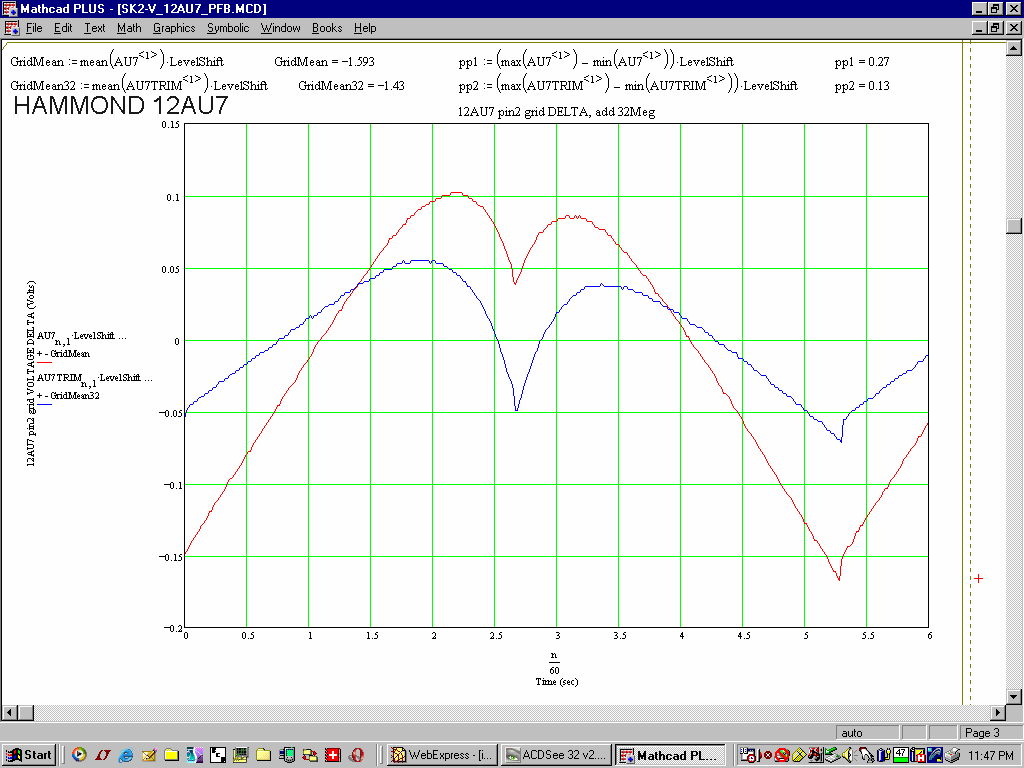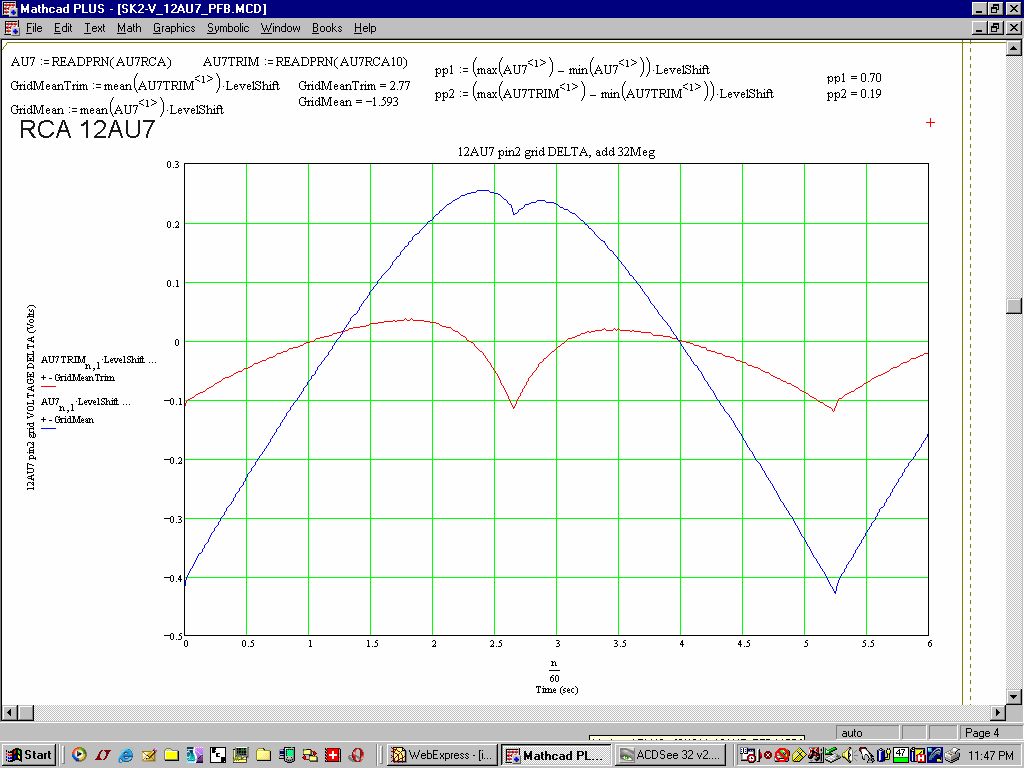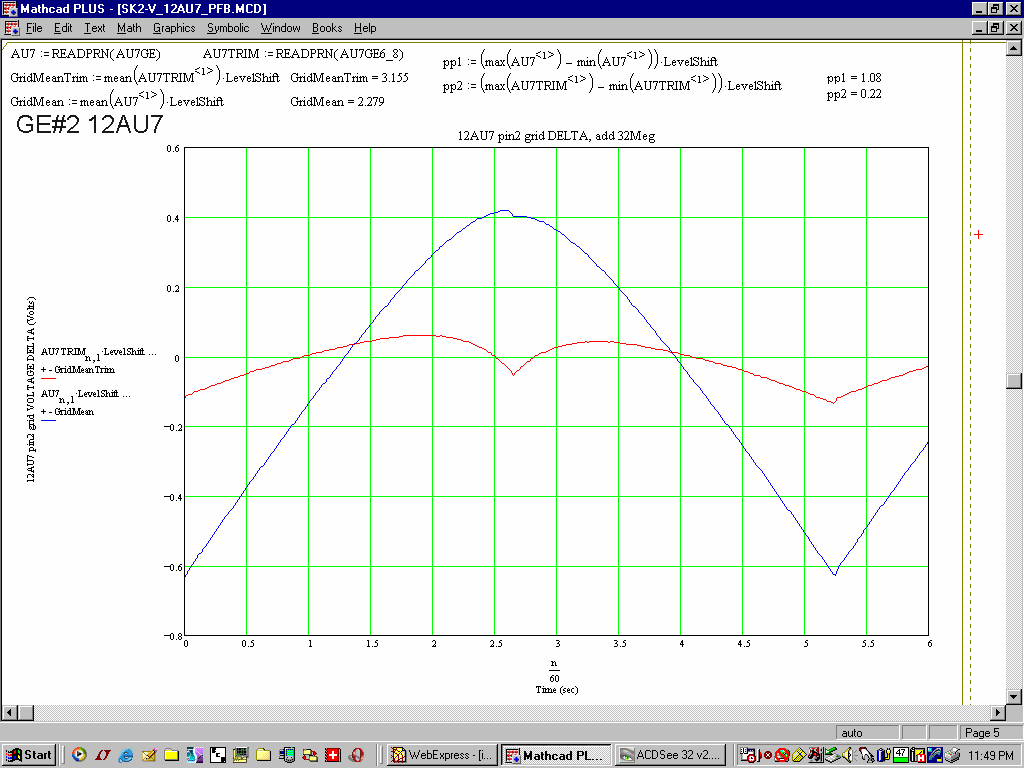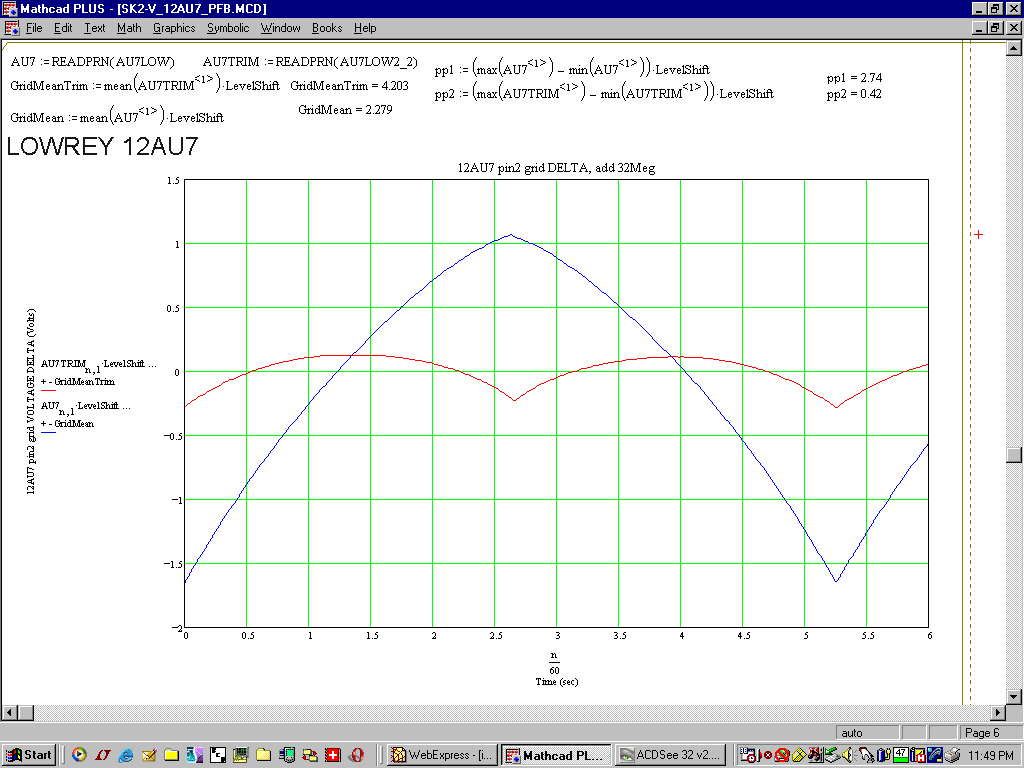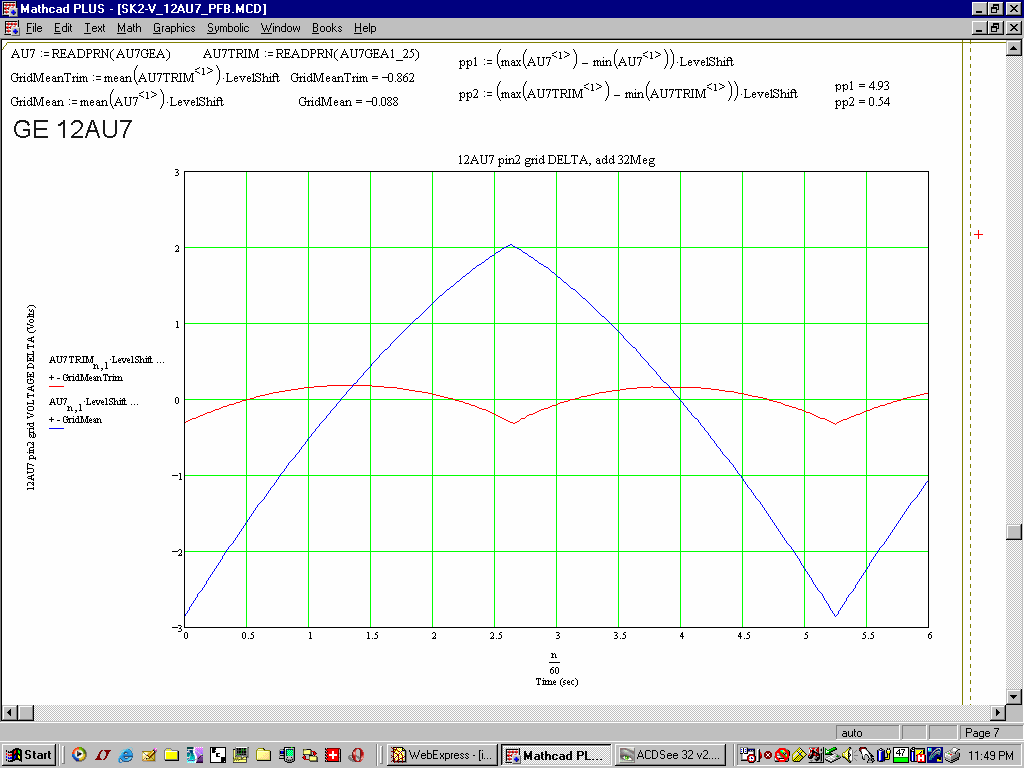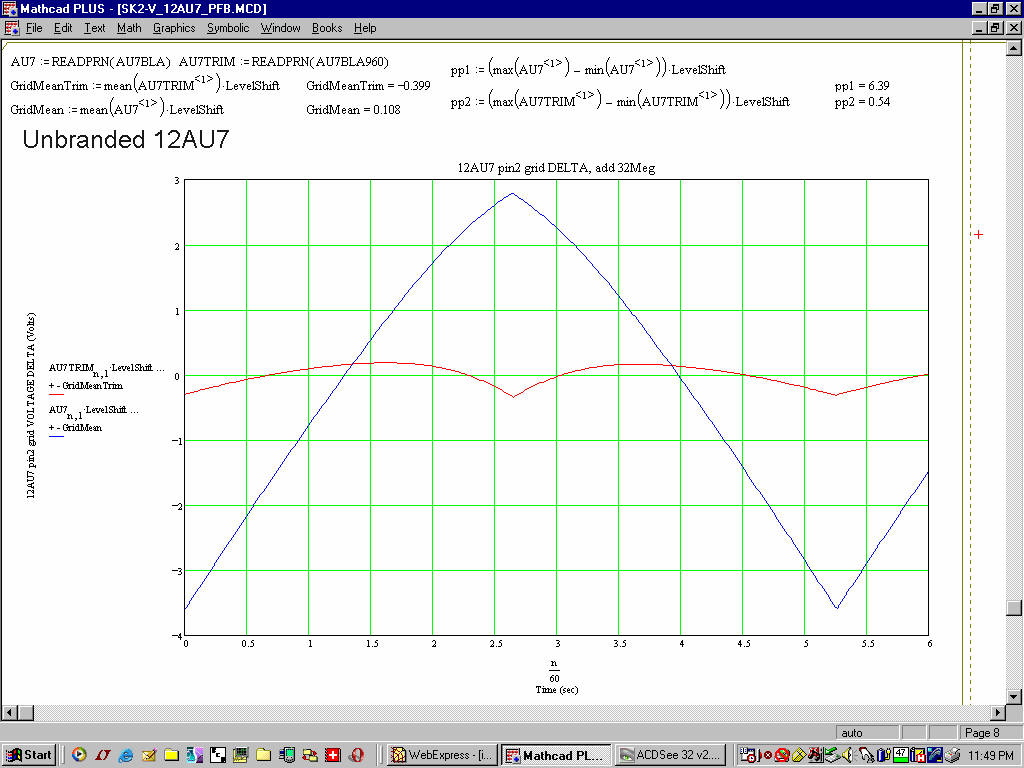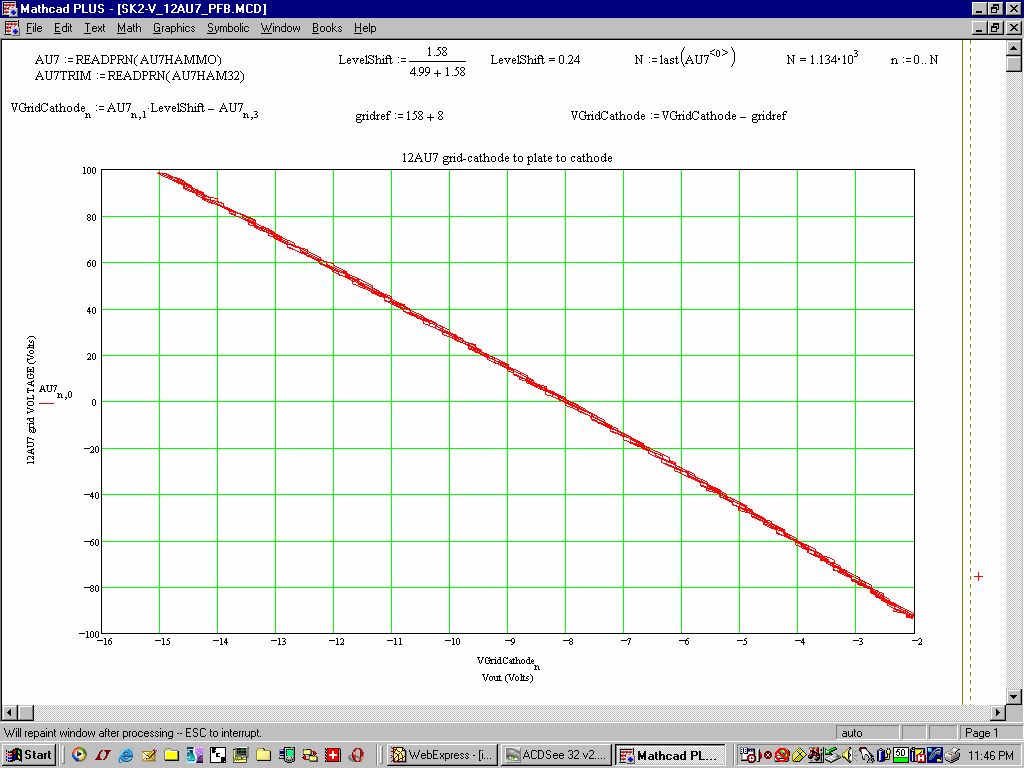
The following plots show the voltage swing at the 12AU7 input for 6 different tubes of various brands. Results in the last 6 plots also show voltage swing before and after adjustment of positive feedback. You can down load these plots in a single PDF file here, which is more suitable for printing.

